Often business analysts need to model the adoption of a new product or service for financial planning.
There are several approaches to model this adoption, but a common one is the s-curve (see Wikipedia article).
Here we present a simple implementation in Excel that can be easily added to your spreadsheets. It reduces all the math to just three parameters:
- saturation – What is the maximum expected penetration after the product becomes mainstream? i.e. what is the value that the top of the s-curve will reach?
- hypergrowth (or start of fast growth) – By this year, the penetration will be 10% of the saturation value, and it will start to grow rapidly. 10% was an arbitrary choice to simplify the model, and by doing some math you could change the formula to any value. It is a reasonable choice in most cases. We’ll call this parameter hypergrowth
- takeover – How long it will take for the product to “catch on”? – The operational assumption in the formula is that this number of years after the start of fast growth, the product would have reached 90% of the saturation value and will start to slow down. Again, 90% is an arbitrary value I chose.
The s-curve model focuses in the early phases of the product lifecycle, until maturity is reached. Penetration decay is NOT covered by this model.
The formula for each year’s penetration would simply be:
=saturation/(1+81^((hypergrowth+takeover/2-year)/takeover))
See it in action:
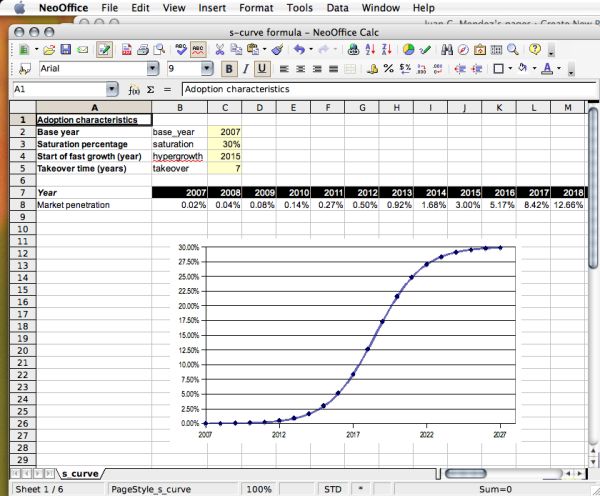
In the sample spreadsheet above, look at cell B8 where you can see the formula in use. It is the same for all row 8.
saturation, hypergrowth and takeover are names defined for the parameters on rows 2 to 5 (you should be using names in your models instead of plain cell references. If not, check this post)
Very simple, easy to maintain, light on calculation times… happy market adoption modeling!